
Introduction of Particle Analysis
Primitive particle size analysis started as early as the use of sieving around 4000 BC. Not until the early days of the development of the microscope in the 1600’s were scientists able to advance the measurement and quantification of smaller and smaller particles. Today, using light and image analysis, the size and shape of dry particles can be performed at a speed and quality only dreamed of by those early scientists.
Modern particle sizing can be performed using highspeed camera systems on particles as large as 135 mm (25.4mm=1 inch) and small as 1 micrometer. In comparison, sieving can measure from 125 mm down to 20 micrometers. The advantage that image analysis has over sieve analysis is that it can be performed faster, on larger quantities, and measuring many more details of every particle analyzed. There is also much less error due to shape. The true length, width, thickness, or identifying characteristics (or defects) for millions of particles in a sample can be analyzed
If smaller particles need to be measured, Laser Diffraction can measure particles from 10 micrometers down to nano size. (1nm=10−9meters. Powders associated with construction materials such as cement, lime, gypsum, vermiculite, slag, mortar and plaster are routinely analyzed using laser diffraction.
Different Sampling Methods and Devices
Large or small volume samples must be sampled properly to obtain a representative sample for particle size analysis.
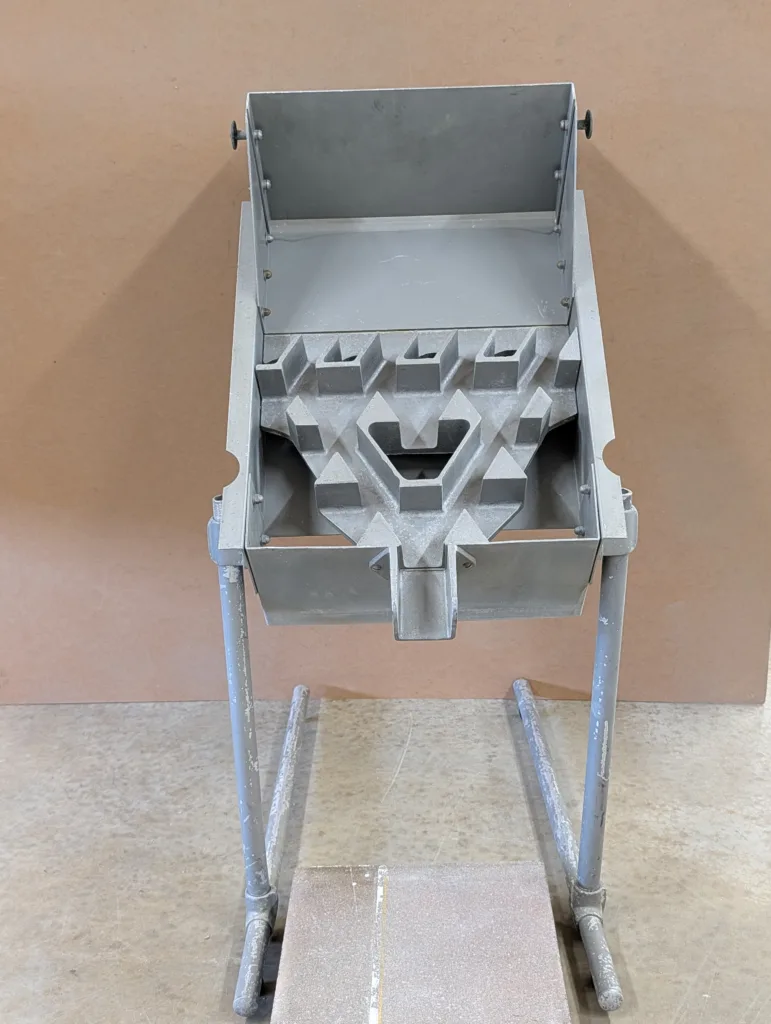
- For 50 lb bags of material a 16/1 sample reducer can be used
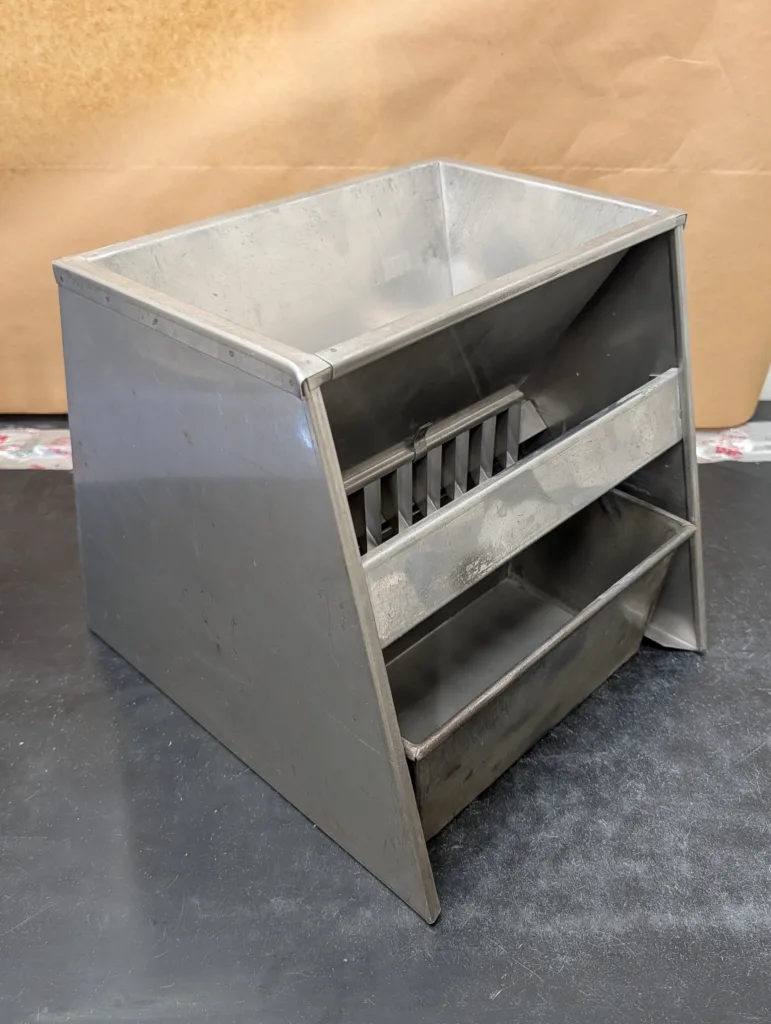
- For large or small samples, a 50 / 50 splitter can be used
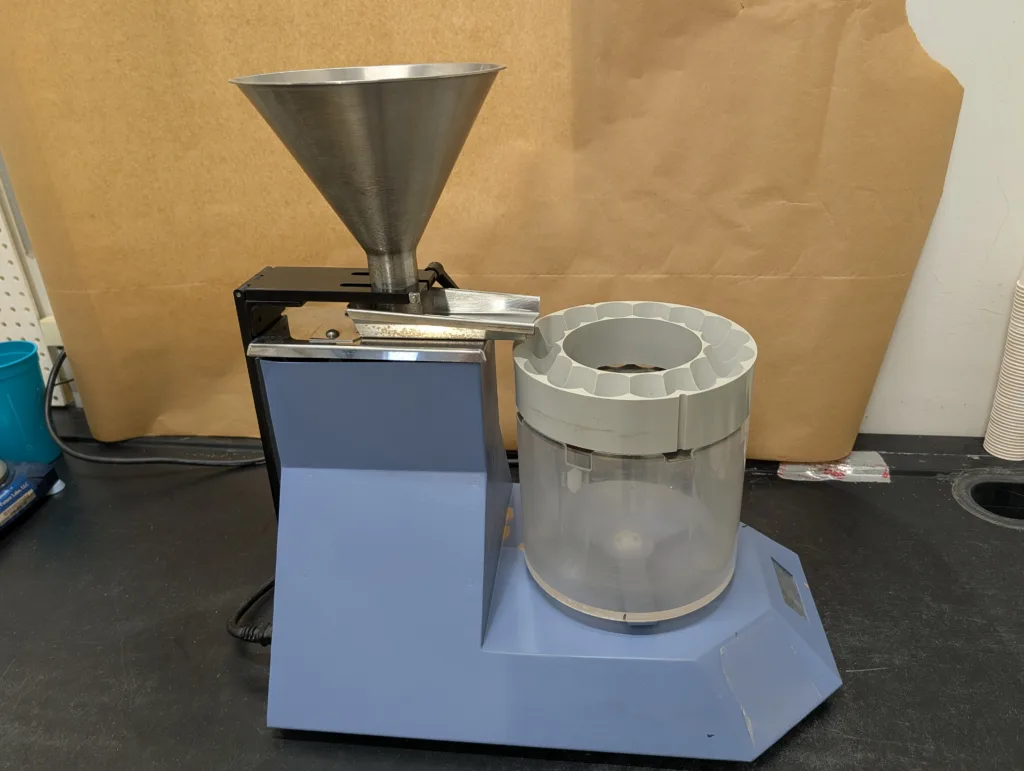
- For medium to small samples a rotary splitter can separate into multiple smaller samples for analysis.
Optical particle size analyzers (PSA) can test samples 24 hours a day 7 days a week. But the smaller the sample the faster the answer. The general rule in PSA testing is that 10,000 particles is a good sampling for data. More of a sample is needed for larger particles than smaller particles to meet that threshold. When running PSA on powders, you may only need a few grams, and most instruments stop when the profile of the gradation (size) stops changing.
Measuring Particle Size and Shape Characteristics with Instrumentation
Dry particle sizing using instrumentation can be performed according to multiple ISO or ASTM standards, including:
- ISO 13322-2 Dynamic Image Analysis Methods
- ISO 13320 Particle Size Analysis by Laser Diffraction
- ASTM B215 Standard Practices for Sampling Metal Powders
- ASTM E1458 Standard Test Method for Calibration Verification of Laser Diffraction Particle Sizing Instruments Using Photomask Reticles
- ASTM E1617 Standard Practice for Reporting Particle Size Characterization Data
- ASTM E2776 Standard Guide for Correlation of Results of Solid Particle Size Measurement Instruments
- ASTM E3340 Standard Guide for Development of Laser Diffraction Particle Size Analysis Methods for Powder Materials
- ASTM D7681 Standard Test Method for Measuring Gradation of Glass Spheres Using a Flowing Stream Digital Image Analyzer
- ASTM D7971 Standard Guide for Measuring Roundness of Glass Spheres Using a Flowing Stream Digital Image Analyzer
Once a sample has been received and reduced, the particle size analyzer needs to be set for the specification / criteria that is called for. Most specifications are based on sieve analysis and therefore have a minimum and maximum allowed for being retained or passing on the sieve or sieves.
Then there are many shape characteristics that can be reported by each particle, including Roundness, Sphericity, Concaveness, Roughness, Smoothness, and other variations and combinations. Some industries still requires Krumbein Shape analysis based on a series of pictures from 1941. Some optical PSAs can give you measurement of the translucency of particles, the identification of all particles of a specific shape, and even the chemical composition using Fourier Transform Infrared Spectroscopy, or FTIR.
Here are a few examples of Particle Size Analyses:
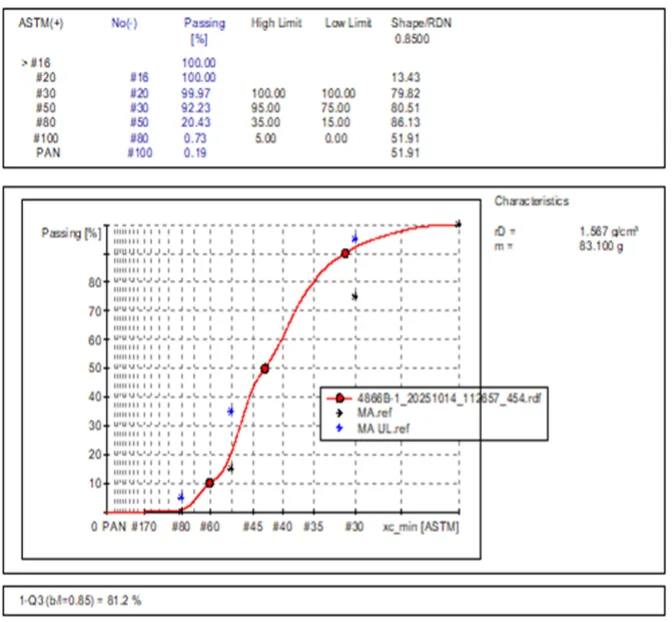
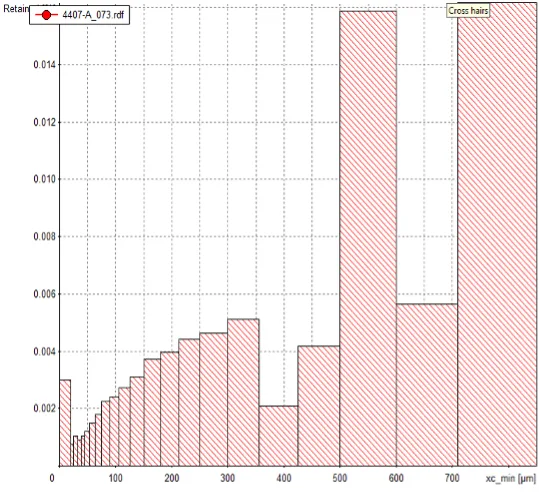
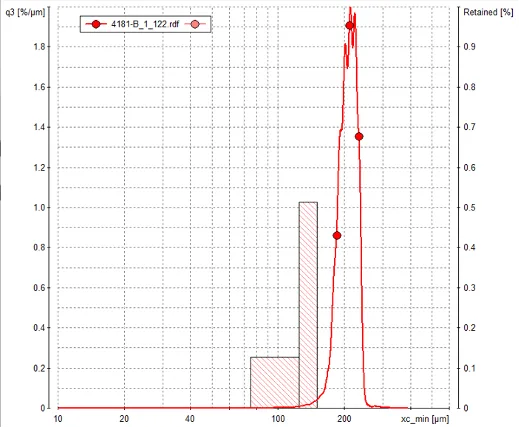
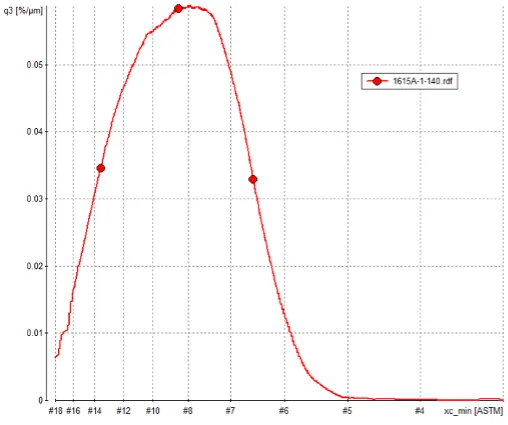
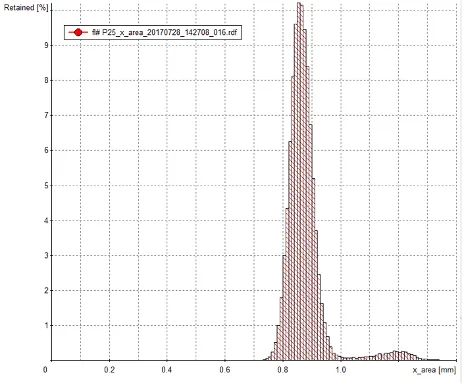
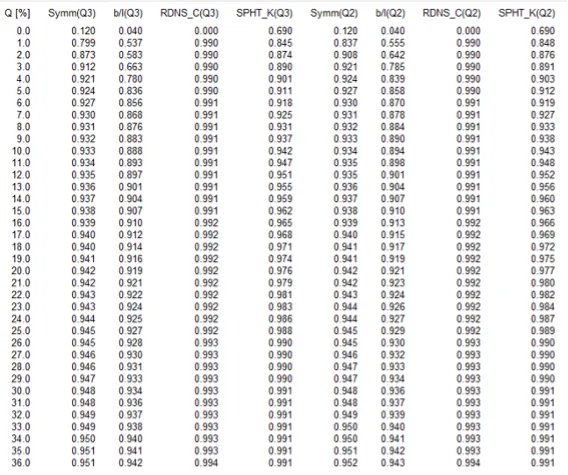
If a relationship with particles to a usage function is of interest, particle size analysis can be performed quickly and give almost infinite information.