
Gas transmission lines are often specified to be coated in a shop using fusion bonded epoxy (FBE) coating systems. These coatings are chosen for the resistance to chemicals, the ease of back filling due to the impact resistance, which also translates to less mechanical damage during the transportation and installation of the pipe sections. One of the drawbacks is the coating at the weld areas or other areas used to join other necessary segments in the field. The same coating materials applied in the shop cannot be applied under filed conditions. Luckily in this case, inspection of the coating of the weld areas noted defects in the shop applied coatings that were not expected. The defects included cracking and blistering of the FBE coating. The failure investigation was initiated to examine pipe sections to determine the causes for the cracking and blistering that were occurring within the coating system or at the interface of the metal surface and the fusion bonded epoxy (FBE) coatings.
The information supplied with the pipes included notations of isolated blisters present on the exterior of the pipe and that the FBE coating film cracked at field bend locations. It was also reported that the initial blisters were observed before the pipe sections were installed and welded. Other blisters were identified on the pipe sections after field installation. It is reported that only four (4) or five (5) blisters were documented at the site and, with the exception of the blistered pipe section sent for laboratory examination, the remaining blisters were repaired in the field. In addition, cracks at field bend locations were holiday tested and repaired in the field shortly after bending took place. It is reported that, in some instances, cracks that were not apparent after bending appeared the following day. Several pipe sections were delivered for examination of the blistering and cracking and laboratory analysis of the coating.
Background
The specification provided for the coating of the pipe sections indicated that the steel surfaces were to be prepared to an SSPC-SP 10, Near White Blast condition. The profile was to be an angular profile measuring 1.5 to 3.5 mils. Once prepared for coating, the pipe sections were to be heated to between 460°F and 500°F, and not to exceed 500°F. The coating was a two (2) coat FBE system with the primer to be applied to achieve a film thickness of 16–20 mils, with an average of 18 mils. The topcoat, or outer jacket, was to be applied immediately after the first coat. The topcoat was to be applied to achieve a dry film thickness of 30–36 mils. The total system thickness was expected to be in the range of 46–56 mils thick. The primer was identified green and the topcoat or outer jacket was brown. The pipes were prepared and coated in a shop and then shipped to the installation sight.
Samples
The samples available to the laboratory were cut in the field from pipe sections at the site by the contractor. The samples were reported to be representative of the typical FBE coating defects being observed in the field. Samples included a section representative of the cracking occurring at the installation site, as well as a pipe section representative of the blistering noted during installation.
In addition, control samples of the specified primer and topcoat materials were received from the manufacturer.
A plasma cutting torch was used to subsection the pipe samples to isolate the defect areas for examination. In the process of torch cutting the sample areas, it was observed that blisters formed in the FBE coating in the heat affected zone around the area being cut. The blisters occurred when the surface temperature around the sample cut was in the 210°F to 220°F range. As the surface cooled most of the blisters shrank back to the pipe surface.
Laboratory Investigation
The laboratory conducted an examination of sections cut from the pipe using a Keyence VHX-500 digital microscope with magnification to 200X. The sections examined were the areas displaying a crack and the large blister. The samples each had two (2) coating layers which measured 25-30 mils each, for an average DFT of 60-63 mils. Recall that the green primer was to be applied at 16.0–20.0 mils DFT, with an average of 18.0 mils and that the brown topcoat was to be applied at 30.0–36.0 mils DFT. The total two (2) coat specified DFT was to be 46.0–56.0 mils. Based on the laboratory microscopic measurements of dry film thickness, it is evident that the first green coat applied to the pipe was considerably thicker (up to 14.0 mils thicker) than specified.
The cracked area of the coating system was viewed through the cross-section to determine if the crack went all the way through the coating system to the metal surface beneath. The cracking was viewed is several areas and in all instances the crack did extend to the metal surface, as seen in Figure 1.
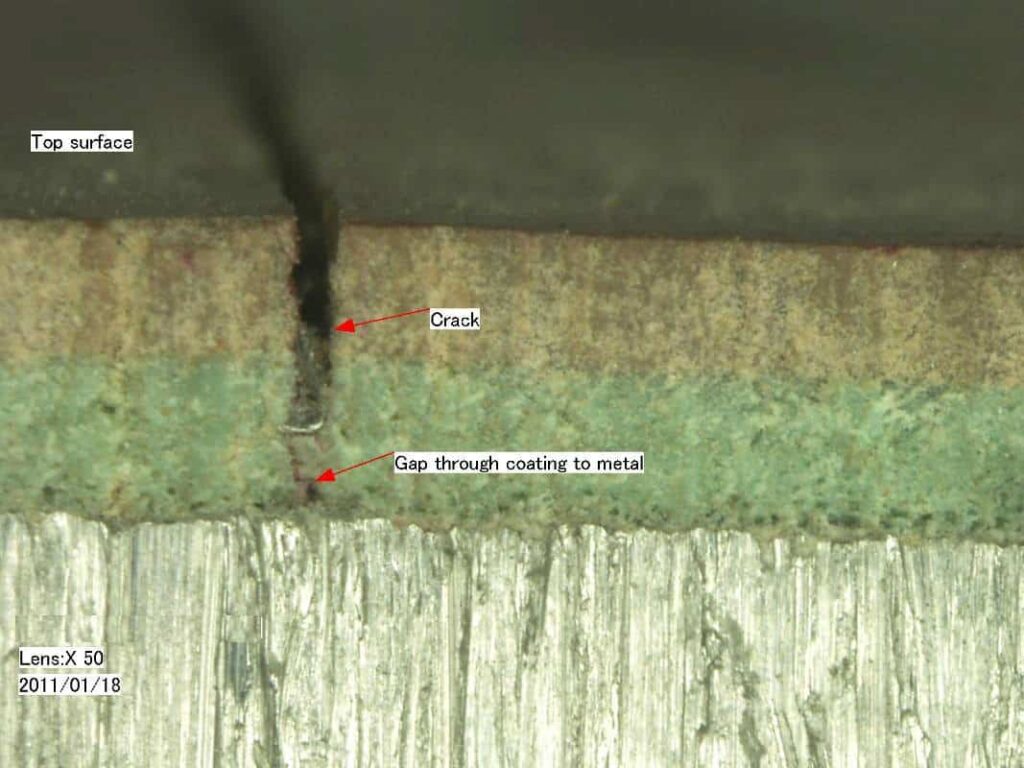
Figure 1 – Cross-Section @ 50X, Crack and porosity at interface
Voids were noted in the green layer close to the metal interface. Additionally, there was a noted separation between the coating and the metal substrate at the interface. It is not known if this was the result of sample removal and preparation or if it had occurred during the field bending. The cross-sectional view also revealed voids at the metal interface and a visual layering effect within the green layer, see Figure 2.
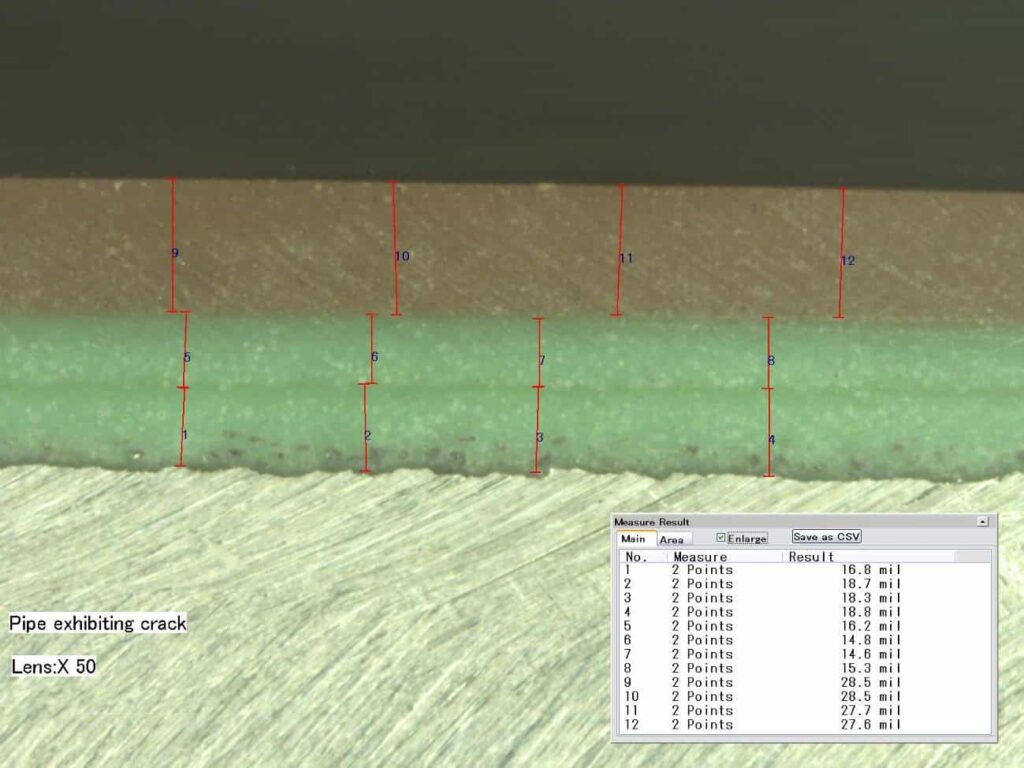
Figure 2 – Cross-Section @ 50X, Away from crack, polished.
Note the striation in the green layer, causing the appearance of two (2) layers.
Examination of the back surface of a blister cap was viewed at 200X magnification, the variations in color and scaling of coating is consistent with cohesive disbondment within the green FBE layer. The back surface of the coating also exhibited several circular voids or shallow craters.
Examination of the steel interface below the blister revealed a thin layer of green coating marked with shallow craters that appeared to be the bottom half of the circular voids or craters observed on the back side of the blister cap above. The coating appeared to be cohesively split causing lighter and darker variations of the green color. There were also areas where the metal was clearly visible. In these areas the metal did not reveal signs of an abrasive blast profile. The lack of profile was represented in Figure 3.
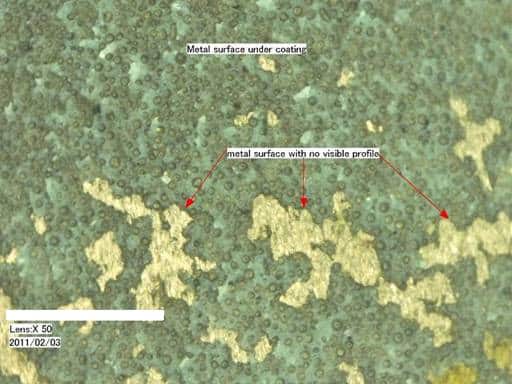
Figure 3 – Metal surface beneath coating @ 50X.
Note the circular void pattern and ‘smooth’ spots on the metal surface.
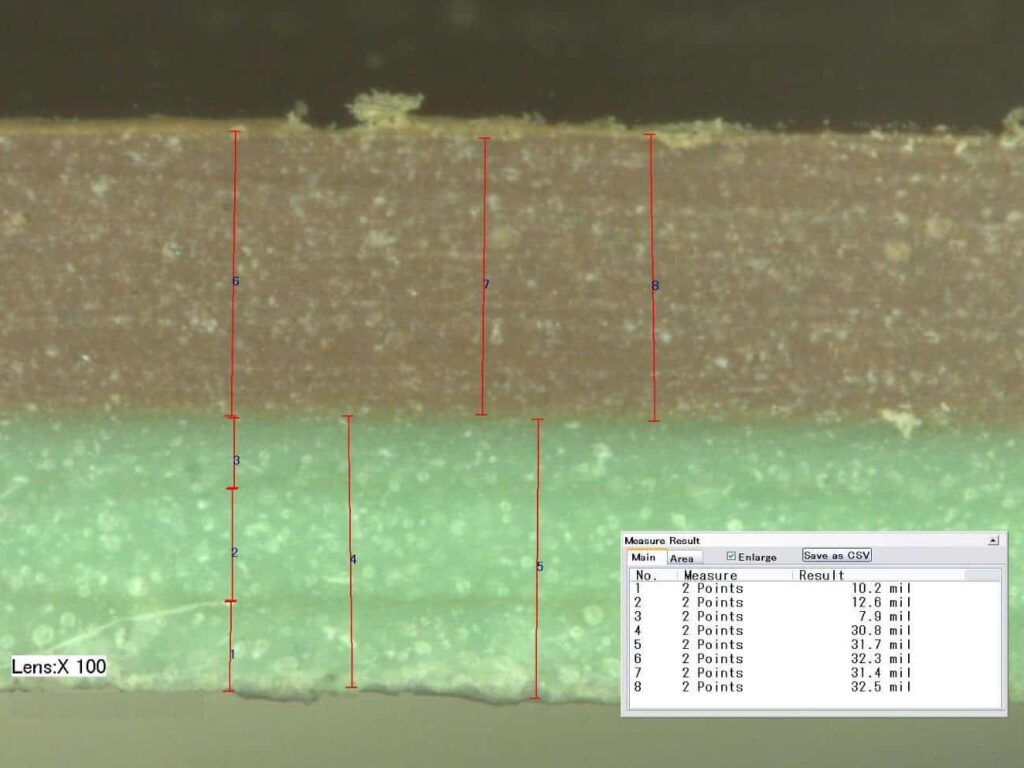
The view of the cross-section revealed two (2) coating layers, but again the green primer contained striations giving the appearance of three (3) layers of green coating, see Figure 4. Additionally, the porosity of the coating layers is visible as the lighter spherical areas in the polished view.
|
Figure 4 – Cross-Section @ 100X, Polished coating in blistered area. Note appearance of three (3) layers in green primer. White areas represent voids in the film. |
In addition to the microscopic DFT measurements, the total FBE dry film thickness around defective areas was determined using a PosiTector® 6000 dry film thickness gage. The thickness readings were obtained in a minimum of six (6) areas on each pipe sample. The range of coating sysem thickness measurements averaged 54.8 – 60.6 mils. Based on these magnetic measurements, the majority of the total two (2) coat dry film thickness was nearer to the upper end or exceeded the specified range of 46.0–56.0 mils.
Since blistering often occurs in when there are contaminants present, samples of the coating and the underlying surface were examined to check for elemental differences that may be indicative of contamination of either the metal surface or the coating material.
To provide a baseline, the control sample of the coating material was scanned, which revealed the presence of high levels of carbon, with lower levels of silicon and calcium as well as carbon and oxygen. The back surface of the coating where the blister had occurred was analyzed for comparison. This analysis revealed the presence of silicon and calcium, as well as carbon and oxygen, which is similar to the original scan of the intact coating. Additionally, a small particle that was evident in the base of a void was scanned to determine if a contaminant was present. This scan revealed the same elements as the general coating with a small amount of titanium in one case. No contamination was identified by this technique.
The analysis of the metal surface identified by microscopy as ‘smooth’ by not exhibiting the profile evident on the other areas of the pipe, revealed the presence of iron with a small amount of oxygen. The elements associated with the coating such as silicon and calcium were not detected. This indicates that no coating is adhering to the metal surface in this area.
Figure 5 is a pictorial reference of the metal surface in the smooth area contains three (3) sections. The upper left section contains the view of the sample. The right upper section is the portion of the sample analyzed. The bottom section contains the spectrograph of the elemental analysis.
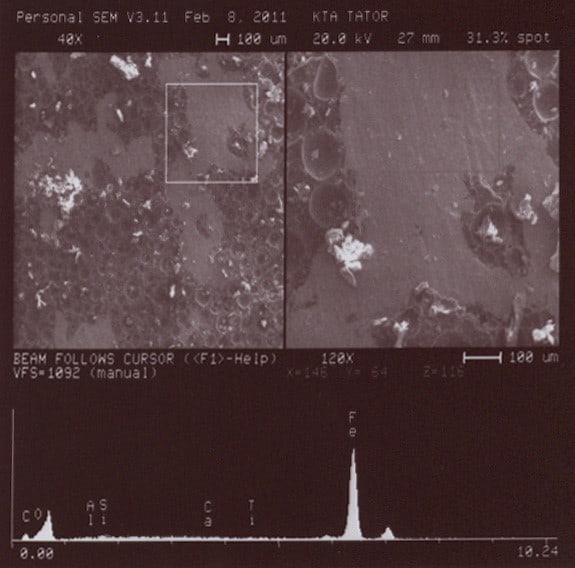
Figure 5 – Area of metal surface exhibiting no profile @ 120X
Differential scanning calorimetry (DSC) was performed to assess the degree of cure of the coating system. A Perkin Elmer Pyris 6 DSC under a nitrogen purge was used to compare each of the supplied control samples, as well as the green primer and the brown topcoat from the pipe. The samples were subjected to a single dynamic heating step from –20 to 210°C increasing 10°C/minute.
Briefly, the analyses revealed the onset glass transition temperatures of the control samples were similar to the onset temperatures of the samples removed from the pipe sections.
Based on the onset glass transition temperatures recorded, there is little to no significant difference between the cure of samples taken from the field pipe versus properly cured control samples received from the manufacturer. Differences of greater than 5°C onset glass transition temperature are considered significant. This information suggests that the FBE coating system applied to the pipe had achieved proper curing.
However, it should be noted that several discrepancies unrelated to measured glass transition temperatures occurred in the duplicate analysis of the coating samples suggest non-uniformity of the coating system. The discrepancies noted include variable coating decomposition temperatures and inconsistent melt events evidence by endothermic peaks.
Holiday testing of the pipe section with the cracked coating was performed using a D.E. Stearns High Voltage Holiday Tester. The voltage range used for testing was 4,800–5,600 volts. This testing was performed to determine if the fine crack in the coating sample extended through the FBE coating film to the bare substrate. This testing confirmed that the crack did extend through (or very near to) the coating to the metal substrate.
Conclusions
The FBE coating on representative pipe samples varied from the coating specification. These variations combined environmental factors were enough to cause the visual defects noted in the coating. In the process of the analytical work, it was observed that the first layer of FBE, the green coating, contained a significant quantity of voids, also referred to as “porosity,” within the applied film. Additionally, the layering of the green coating indicates that the final film characteristics may have also been affected by the thick application of the material.
Cracking of FBE Coating
In the process of field pipe bending, project personnel reported that cracking of the FBE coating system occurred on the outside radius of the bend. The cracks were reportedly field repaired as they occurred. Field personnel also reported that some cracks appeared approximately one (1) day after bending took place. Examination of the crack by holiday testing and additional microscopic examination of the cracked area both confirmed that the crack penetrated the entire coating system thickness to the steel substrate.
Since it was known that this coating system should be able to bend with the pipe section as required, differences in application and variations from the specification were evaluated. Laboratory microscopic measurements of the dry film thickness of Sample KTA-1 found that the green primer layer was significantly thicker than specified. The specified thickness was 16.0–20.0 mils with an average of 18.0 mils. The measured thicknesses ranged from 32.9–34.0 mils. Further information from the field indicated that the cracking problems were associated with the bending pipe sections where the coating layer was greater than 20.0 mils. Coatings that are thicker than specified develop greater stress than coatings of proper thicknesses when stretched and/or flexed. If the stress becomes too great, the coating cracks to relieve the stress. In addition to the increased coating thickness, cold temperatures (field bending reportedly occurred in cold weather) will reduce the flexibility of the coating. An excessively thick coating and a cold coating film is more prone to cracking. The evidence suggests that these factors (excessive thickness, cold temperatures) were major contributing factors to the cracking problem during field pipe bending.
Blistering of FBE Coating
Blister formation in a coating system is generally caused by some well known phenomena. Because the phenomena are known, determining the actual cause of blistering often becomes a process of elimination. One mechanism for blister formation starts with some form of water soluble contamination (i.e., salt [chloride] or other soluble salts) on the bare pipe surface at the time of FBE application. In short, virtually all coating systems, FBE included, transfer moisture vapor, to some degree, back and forth through the film. As long as moisture vapor transfer remains in equilibrium, the coating system is generally fine. However, when water soluble or “water loving” contaminants are present at the interface of the metal substrate and the coating, moisture vapor is attracted to these areas. As a result, water accumulates as it dissolves the contaminant creating vapor pressure at the substrate/coating interface. As additional water vapor is attracted to these areas the pressure increases, pushing out the coating film to form a blister. This process is commonly referred to as osmotic blistering. In addition to soluble salt contamination, the blistering process can also be driven by differences in temperature or “thermal gradients” over a coated surface and also as a result of problems with cathodic protection systems (cathodic blistering). Because many of the variables that can lead to blistering are known, laboratory work can be used to test those variables. In that regard, cathodic blistering can be eliminated as a potential cause because the cathodic protection system was not yet in service on these pipes.
The microscopic analysis identified areas of the metal pipe surface that were “smooth” and did not exhibit a roughened surface texture or profile. This finding suggests that there were very small areas where the surface profile produced by blast cleaning was somehow “smoothed out.” This is believed to be a result of the shop grinding process that is used after blast cleaning to remove small base metal protrusions etc., or possibly from contact with metal rollers along the production line. While these small areas can weaken adhesion and allow for blister-like disbonding to occur, their contribution, if any, to the observed blistering problem is believed to be minimal. Had these small areas played a significant role, it would be expected that blister-like formation would have been more prevalent across the pipe surface rather than at a few (four [4] or five [5]) isolated areas.
With regard to thermal gradients as a cause of blister formation, the probability of the contribution to this application does exist. Because field welding of pipe took place in periods of colder weather, significant temperature variance on areas of the pipe was a possibility. In fact, since a plasma torch was used to cut smaller samples from the pipe sections at room temperature, it was observed that blisters formed in the FBE coating in the heat affected zone around the area being cut. The blisters occurred when the surface temperature around the sample cut was in the 210°–220°F range. As the surface cooled, the blisters contracted. After cooling, most blister sites were not visible, but a few shallow areas did remain and were removed for further laboratory analysis. In all instances, the laboratory analysis (microscopic and SEM) did not detect any contaminants (i.e., chlorides or other soluble salts) that would suggest a cause for blister formation. However, as with other blistered samples, a microscopic examination of the back surface of the blister cap did reveal the presence of significant concentrations of bubble-like formations or “porosity” in the FBE film. Furthermore, an examination of the pipe surface beneath the blister revealed that a thin and porous film of FBE remained on the surface. On some samples the FBE layer fractured within the porosity such that half of the bubble was visible on the back surface of the blister cap and half remained on the metal surface. This finding indicated that porosity set-up a weak link in the FBE coating film. The significance of the porosity in the FBE film is discussed later in this section.
Curing of the FBE Coating
Proper curing of an FBE is critical for optimal coating performance. In order to determine if lack of proper cure may have contributed to the observed coating problem, the cure of the coating was assessed using differential scanning calorimetry (DSC). The information obtained by this method suggests that the FBE coating system had achieved proper cure. Some variations noted between replicates may indicate that the excessive thickness did hinder the consistency of the cure in some areas.
Porosity of the FBE Coating
Porosity in an FBE film is not uncommon and if minimized to a specific level does not impact overall performance. However, higher concentrations of porosity within an FBE film can be problematic. Many specifications reference a porosity rating chart to quantify the permitted level of porosity for a particular application. The specification for this project did reference charts for porosity. These charts are readily accessible references.
Cross-sections of the samples were compared to the reference materials. The level of porosity noted on the samples was higher than recommended in the specification and reference materials indicate that increased porosity could lead to a weakened area within the thickness of the coating layer.
Porosity formation can be a result of the interaction of multiple variables during the application process. While moisture in the FBE powder is often a significant cause, other variables such as the powder coating formulation, the temperature at which the powder is applied, spray gun placement, application rate, contamination on the bare pipe surface or outgassing from the steel can also contribute to porosity. Excess porosity requires careful analysis of all possible variables in order to more precisely determine the cause. Unfortunately, porosity was not a concern until observed in the KTA laboratory samples. Therefore, any application related issues (i.e., moisture in the powder, actual gun arrangement, application temperature and rate, surface contamination) were no longer available for study. After the fact, some of the information can be obtained by reviewing quality control documents filled out during application, but the information is more limited.
In addition to porosity, the microscopic view of the cross-section of the green coating layer revealed striations within the layer. Although the striations do not indicate a defect in the coating, their appearance can be associated with variability in the application/curing process. Striations occur when the FBE is not at the proper gel stage of cure when additional coating is deposited. When the underlying coating is at the proper gel stage, the application of additional powder coating does not produce visible striations and the total application appears as a single homogenous layer. The absence of any delamination or separation at these striated areas indicates that the FBE powder had sufficiently melted, cured, and bonded with the underlying material to form a layer. In addition, the integrity of the coating film did not appear to be compromised since the layer was tightly adhered. The striation issue would need to be discussed with the FBE powder manufacturer in order to determine if any longer term performance issues would be anticipated. In this case the striations may be associated with the additional thickness of the applied coating changing the heat absorption capacity of the coating layer.
Recommendations
For the current application, it was understood that the isolated blisters and cracks that formed during bending operations were field repaired and coated. Because latent cracking was sometimes not apparent until the day after bending operations, there is concern that some cracks in the FBE may have inadvertently been missed. In that regard, additional inspections at bend areas are recommended prior to backfilling. If the pipes are already buried, then careful monitoring of CP current demand would appear to be the method for evaluating FBE performance. The same would be true in attempting to determine if the level of porosity observed in field samples is present on other buried pipe surfaces and is having a negative impact on the coating system performance. A CP current demand in excess of what is normally observed may be an indication of that the FBE coating system is not performing properly.
For future applications, it is suggested that the application parameters be controlled more diligently and that the porosity of the film be checked at various times to ensure that the coating meets the specified requirements before being installed in the field.
About the Author:
Valerie Sherbondy PCS
KTA-Tator, Inc.
Valerie Sherbondy is the Technical Manager for the Analytical Laboratory for KTA-Tator, Inc., a consulting and engineering firm specializing in industrial protective coatings. Ms. Sherbondy has been employed at KTA since 1990 and has provided laboratory support for the investigation of hundreds of coating failures and coating testing programs. She holds a B.S. in chemistry from the University of Pittsburgh and is an SSPC-Certified Protective Coating Specialist, a member of the American Chemical Society (ACS), and a committee chair for NACE International.
Also contributing: Richard A. Burgess, Series Editor


Good reference (case study) for FBE coating defect.